
How to Look Up Bell County Jail Population Data
Three sources carry most of the useful numbers. The Texas Commission on Jail Standards is the state regulator. It inspects county jails and publishes capacity and population reports, and its current incarceration-rate report is the figure to trust for official counts. The Vera Institute runs a county trends tracker that turns years of data into charts. For national comparison, the Bureau of Justice Statistics defines terms and publishes jail population data across the country.
Reading these sources takes a little care. The state report often captures the population on the first day of the month, broken out by legal status and sex. Vera shows multi-year trends and a rate per 100,000 residents. Federal data sets the national baseline. None of these is a live count. The state jail standards site updates on its own report schedule, so treat each number as a snapshot tied to the date it was pulled.

The state regulator is the controlling source when its figures differ from news reports or third-party trackers.
Bell County Jail Capacity Overview
Bell County runs two jail sites in Belton, the Central Jail and the Loop Jail. The official county pages do not publish a bed-by-bed capacity split for each site. After a recent expansion, 2026 local news reported a total expanded capacity of about 1,916 beds, with roughly 600 empty beds and a jail budget near $46.2 million. Those are news figures, not an official county or state release. For a final capacity number, use the current state jail standards report. The table below shows what is and is not published per facility.
| Facility / Source | Rated Capacity | Population / Notes |
|---|---|---|
| Bell County Central Jail | Split not published | County lists address and phone lines only. |
| Bell County Loop Jail | Split not published | Expansion site; per-facility split not published. |
| Bell County Jail total (state report) | Use current state report | Official source for capacity and population. |
| Bell County Jail total (2026 local news) | About 1,916 reported | Roughly 600 empty beds reported; news context only. |
Note: capacity is the number of approved beds, which is not the same as how many people are actually held on any given day.
Average Daily Population
Average daily population, or ADP, averages the daily head count over a stretch of time. It smooths out the bumps. A single day can spike after a big arrest sweep or drop after a court releases several people, but the ADP tells you the typical load. Bell County's recent expansion means its capacity grew faster than its average count, which is why news reports describe empty beds.
For the current ADP, pull the state jail standards monthly or annual report rather than a news number. ADP is not the same as capacity and not the same as a first-of-month count. A county can sit well under capacity on average yet still have busy days. The state report and the Vera tracker both help you see the average against the trend line.
Why does ADP matter to a record seeker? A higher average count usually means longer waits for bond hearings, slower court settings, and a fuller roster to search. A lower count can mean cases are clearing faster. Either way, the average is a planning number, not a promise about any single day, and it should be read next to the capacity line for context.
Pretrial vs. Sentenced Population
Not everyone in jail has been convicted. The population splits into people held before trial and people serving a sentence. Pretrial means the charge is still pending, not that the person has no record or no other hold. Sentenced jail population means a local jail term is being served; people sentenced to state prison usually move to a state unit once processed. The concept table below sorts the two.
| Status | What It Means |
|---|---|
| Pretrial | Held on a pending charge, not yet convicted on that case; may still have other holds. |
| Sentenced | Serving a local jail sentence; state-prison terms transfer out to a state unit. |
The state report breaks the count further into pretrial misdemeanor, pretrial felony, convicted misdemeanor, and convicted felony, plus bench warrant and parole violator counts. Vera's tracker shows the pretrial and sentenced split across years, which helps reveal whether the jail is filling mostly with people awaiting their day in court.
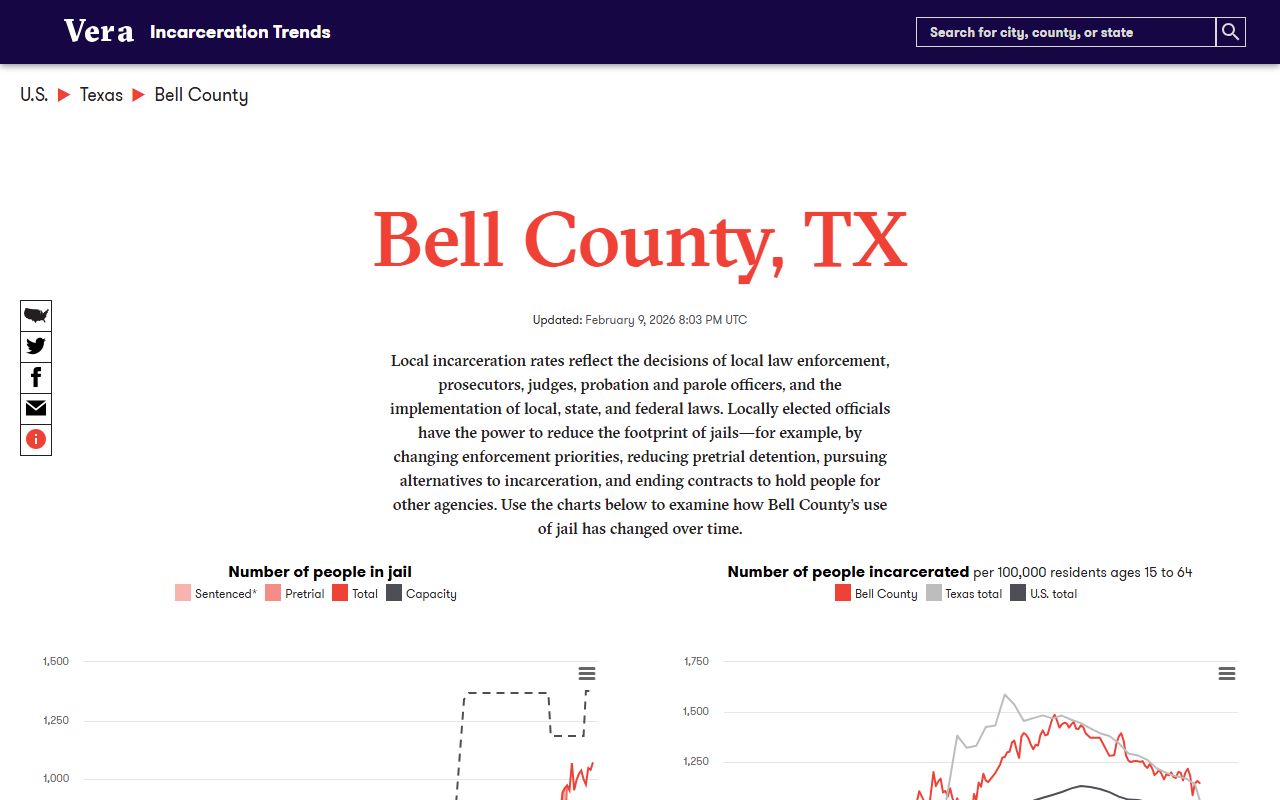
The Vera county trends page visualizes the pretrial and sentenced lines over a five-year window.
Misdemeanor vs. Felony Population
Charge level is another way to slice the count. The state report tracks misdemeanor and felony holds separately, and within each it marks pretrial against convicted. Felony holds tend to run longer, so they often weigh more in the daily count even when misdemeanor bookings are more frequent. A blue warrant or a parole violator hold can keep a person in jail without a regular bond, which also shapes the mix.
Bell County's exact misdemeanor and felony split moves month to month, so the current state report is the place to read it. The point for a searcher is simple. A high felony share often points to longer stays and more pretrial holds, while a misdemeanor-heavy count can move faster as cases clear or bonds post.
Jail Expansion and Contract Beds
Bell County expanded its jail, and that changed the math. With more beds than the county needs for its own inmates, the county has looked at leasing unused beds to offset costs. In February 2026, local reporting said the Commissioners Court approved a contract to house San Saba County inmates, tied to the extra capacity from the expansion. That is a news report, so confirm the contract terms through official Commissioners Court minutes before treating it as settled fact.
Contract beds matter for population data because they add people who are not Bell County cases. So a jail count can rise from out-of-county inmates even when local arrests hold steady. When you read a total population figure, check whether it includes contract or federal holds. The state report separates these categories, which is why it is the cleaner source for a true local count.
Compliance and Inspection Context
The state jail standards commission inspects county jails and can cite a jail for falling short of minimum standards. On December 22, 2025, the commission issued a notice of non-compliance for the Bell County Jail, based on a December 2025 inspection. The notice cited a medication distribution problem under minimum standard 273(7). The report described a large share of prescribed medication events that were not dispensed over a set window in late 2025.
This kind of notice is jail-operations context, not a population figure, but it shows why the state regulator is the right source for official jail data. Compliance status, capacity, and population all flow from the same inspections. For the exact wording of any compliance finding, read the commission's own document rather than a summary.
National and State Context
A raw head count means little without a yardstick. That is where a rate per 100,000 residents helps. It adjusts for population size, so you can compare a county to the state and to the nation on even footing. The Vera tracker reports a Bell County jail rate, and the federal data agency reports state and national jail rates. The comparison block below frames the three levels. Treat each as context, not as a single matched-date figure.
| Level | Jail Population per 100,000 | Source |
|---|---|---|
| Bell County | See current Vera county rate | Vera Institute county tracker |
| Texas | See current federal jail data | Bureau of Justice Statistics |
| National | See current federal jail data | Bureau of Justice Statistics |
The federal justice statistics site defines jail terms and sets the national and state baseline for these rates.
Because each agency pulls data on its own schedule, line up the report dates before you compare a county rate to a national one.
Population Trends Over Time
Trends say more than a single snapshot. Many Texas counties saw their jail counts swing during and after the pandemic, as courts slowed and then caught up. Bell County's expansion sits on top of that, so capacity climbed even where average population did not. Reading a five-year line shows whether the jail is filling, emptying, or holding flat.
The Vera tracker is built for this view. It charts the population, the pretrial and sentenced split, and the capacity line across recent years. Pair it with the state report for the current month and you get both the long arc and the present count. Keep the three measures separate as you read, since capacity, ADP, and first-of-month population each answer a different question.
Searching for Bell County Inmate Records by Name
This page covers aggregate jail population data, not individual lookups. To search for one person on the live jail roster by name, booking number, or subject number, use the Bell County inmate records page, which explains the roster portal and the detail fields.
Where the Data Comes From
Three official or research sources feed this page. The state jail standards commission supplies capacity, compliance, and first-of-month population through its inspections and reports. The Vera Institute turns county data into trend charts, including the rate per 100,000. The federal justice statistics agency sets national definitions and comparison numbers. For budget and contract details, official Commissioners Court minutes and the adopted county budget are the authoritative records.
Use the source that matches the question. For an official current count, read the state jail standards report. For a multi-year trend, read the Vera county page. For national framing, read the federal statistics site. When a news figure and an official figure disagree, the official report controls.